David Barton
Where is the boat nowExperiments: ThumbNails
Frank: Database
1 Layer
 1 Layer
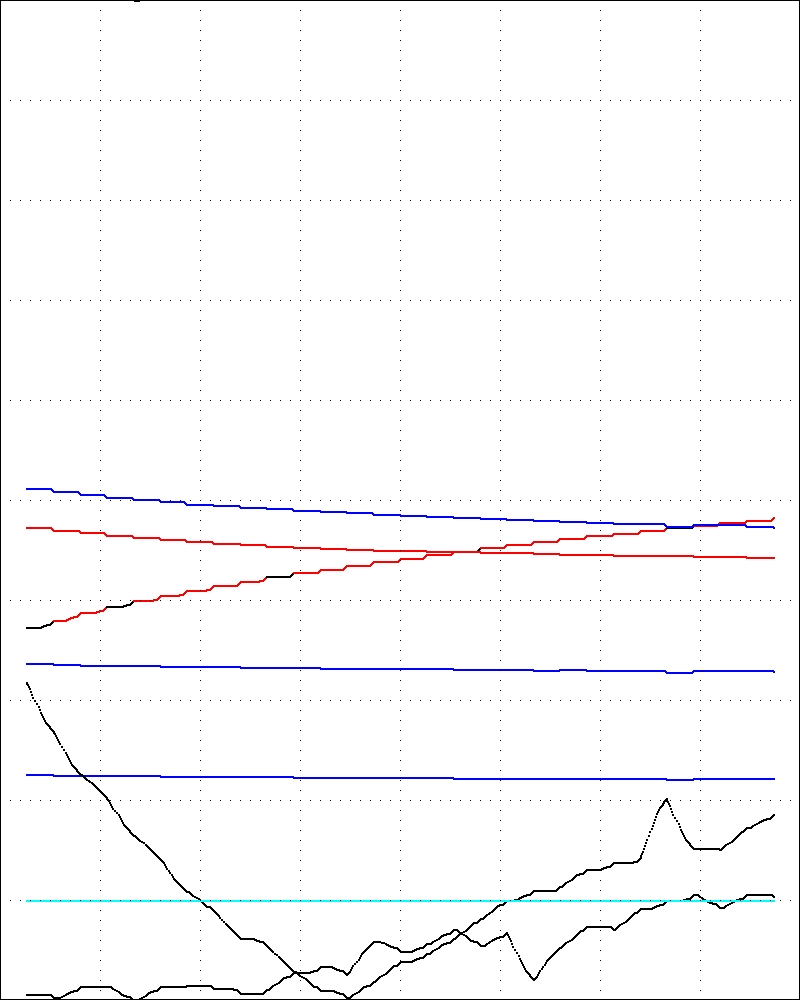 3 Layer
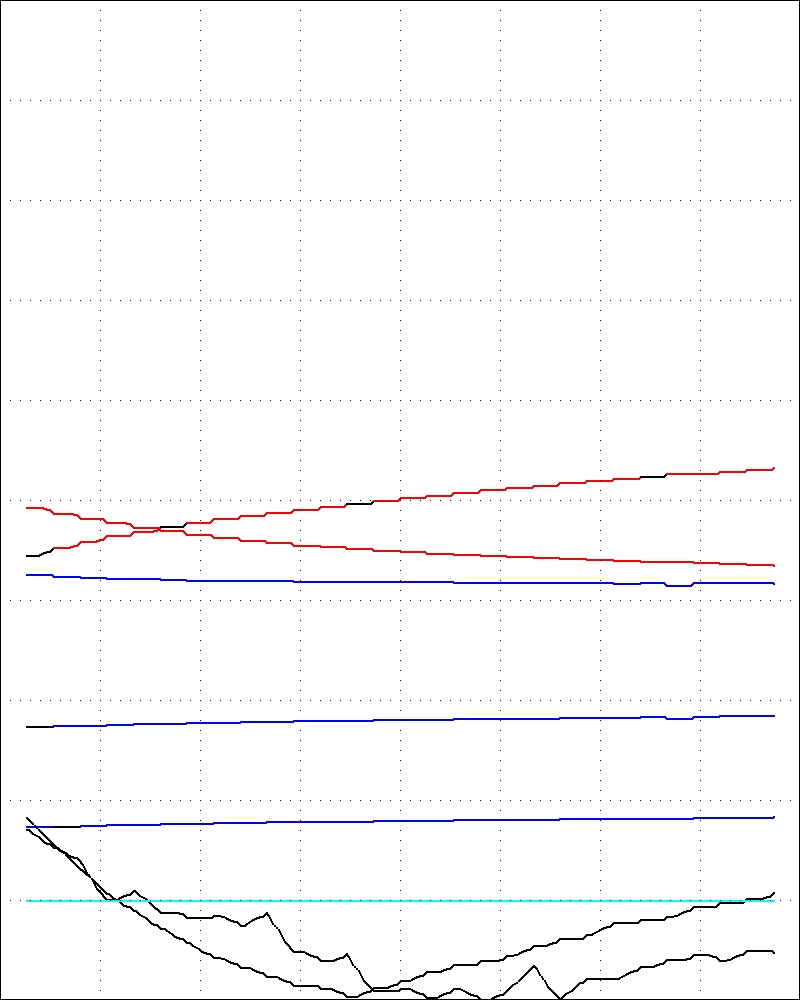
Delphi
The blue curves are the thickness (nominal 10, 15, 20nm)The black curves are statistics that estimate the optical/mathematical flatness of the surfaces
and the proximity of the point (n,k,d) to the three tubes. If these curves
are below the cyan line then the model is good at that wavelength.
The red curves are n and k against wavelength.
aXX
a a a a a a a a a a a a a a a a a a a a a a a a a a a a a a a a a a a a a a a a a a a a a a a a a a a a a a a a a a a a a a a a a a a a a a a a a a a a a a a a a a a a a a a a a a a a a a a a a a a a a a a