Notes Taker: Congjun Yang
Lecture # 17
Date : Nov 9th 98.
Voronoi Diagram
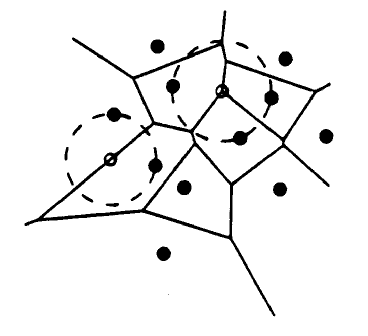
1. DEFINITION
Let P = {p1, p2,
, pn} be a set of n
given point sites in the plane. We define the Voronoi diagram of P as the
subdivision of the plane into n cells, one for each site in P, with the
property that a point q lies in the cell corresponding to a cell pi
iff
dist(q, pi) < dist(q, pj) for each pj
in P with j ¹ i. We denote the Voronoi
diagram of P by Vor(P). The cell that corresponds to a site pi
is denoted V(pi).
The Voronoi diagram is a planar subdivision whose edges are straight
line segments. Some edges are line segments and others are half-lines.
Unless all sites are collinear there will be no edges that are full lines.
2. PROPERTIES OF THE VORONOI DIAGRAM
THEOREM 1: The Voronoi diagram of a set of n point sites in the plane has
at most 2n-5 vertices and 3n-6 edges.
Idea of Proof: Using Euler's formula: for any connected planar embedded
graph with nv nodes, ne edges, and nf
faces the relation nv - ne + nf = 2 holds.
We know that edges of Vor(P) are parts of bisectors of pairs of sites
and the vertices of Vor(P) are intersection points between these bisectors.
There is a quadratic number of bisectors, whereas the complexity of the
Vor(P) is linear. Hence, not all bisectors define edges of Vor(P) and not
all intersections are vertices of Vor(P). The following theorem characterizes
the vertices and edges of the Voronoi diagram.
THEOREM 2: For the Voronoi diagram Vor(S) of a set of points
S the following holds:
-
A point q is a vertex of Vor(S) iff its largest empty circle C(q) contains
three or more sites on its boundary.
-
The bisector between sites pi and pj defines an edge
of Vor(S) iff there is a point q in R2 such that C(q) contains
both pi and pj on its boundary but no other site.
In the theorem, the largest empty circle of a point q, denoted C(q), is
defined as the largest circle with q as its center that does not contain
any site of P in its interior.
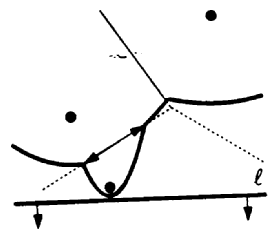
3. COMPUTING THE VORONOI DIAGRAM (Fortune's Algorithm)
Strategy: Sweep a horizontal line - the sweep line - from top to
bottom over the plane.
Difficulty:The part of Vor(P) above the sweep line l depends
not only on the sites above l but also on sites below l.
Observation:For any point q above the sweep line l, the
nearest site of q cannot lie below l if q is at least as near to
some site above l as q is to l.
Beach line: The locus of the points that are closer to some site
above the line l than to l itself is bounded by parabolic
arcs. We call the sequence of parabolic arcs the beach line. This
is shown by the thick piecewise smooth curve in the figure below.
Inductive Assumption: By the observation above, we inductively
assume that Vor(P) is completely determined above the beach line. The portion
between the beach line and the sweep line cannot yet be determined since
it could be affected by points below the sweep line l that have not yet
been encountered.

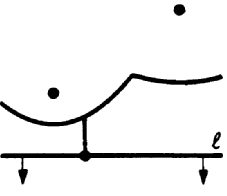
It is easy to see that several disjoint portions of the same parabola
can be part of the beach line. Notice that the breakpoints between the
different parabolic arcs forming the beach line lie on edges of the Voronoi
diagram. The breakpoints exactly trace out the Voronoi diagram as the
sweep line moves from top to bottom.
We do not maintain the beach line explicitly, since it changes continuously
as l moves. Instead, we only maintain the breakpoints using a binary
tree T as follows.

Each leaf stores the site that defines the arc it represents. The internal
nodes represent the breakpoints on the beach line. A breakpoint is stored
at an internal node by an ordered pair of sites <pi, pj>,
where pi defines the parabola left of the breakpoint and pj
defines the parabola to the right.
When and how does the combinatorial structure of the beach line change?
This happens either when a new parabolic arc appears on it or when a parabolic
arc shrinks to a point and disappears.
-
Site Event: When the sweep line reaches a new site, a new arc will
appear first as a degenerate parabola. As the sweep line moves down the
new parabola gets wider and wider. At a site event two new breakpoints
appear and start tracing out edges.

-
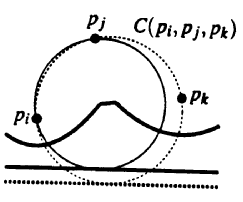
Circle Event: For any three consecutive arcs a,
a,
and a" defined by three distinct sites pi,
pj, and pk, at the moment an arc a
disappears, the parabolas defined by these three sites pass through a common
point q. Point q is equidistant from l and each of the three sites.
There is a circle passing through pi, pj, and pk
with
q as its center whose lowest point lies on l. There cannot be a
site in the interior of this circle: such a site would be closer to q than
q is to l, contradicting the fact that q is on the beach line. It
follows that q is a vertex of the Voronoi diagram.
So when an arc disappears from the beach line and two break points
meet, two edges meet as well. We call the event where the sweep line reaches
the lowest point of a circle through three sites defining consecutive arcs
on the beach line a circle event.

The event queue Q is implemented as a priority queue, where the priority
of an event is its y-coordinate. It stores the upcoming events.
-
All site events are known in advance.
-
Detection of the circle events: For any three consecutive arcs on the beach
line, the corresponding circle event is in the event queue Q if the circle
intersects the sweep line. If the circle lies completely above the sweep
line, then the event has already been dealt with. Also if the circle contains
some other sites in its interior the event should not be handled.
When a triple of consecutive arcs is destroyed, we delete the corresponding
circle event from Q, if it occurs in Q. Suppose that an arc disappears
from the beach line, or it is split, and we wish to delete all circle events
the arc participates in. We first search in T for the leaf m
storing the site defining the arc. At that leaf there is a pointer to a
circle event to let us find the circle event in the event queue Q quickly.

Now, we are at the point to see the exact algorithm
Algorithm VoronoiDiagram(P)
Input: A set P = {p1, p2,
, pn}
of point sites in the plane.
Output: The Voronoi diagram Vor(P) given inside a bounding box
in a doubly-connected edge list structure.
-
Initialize the event queue Q with all site events.
-
While Q is not empty Do
-
Consider the event with largest y -coordinate in Q.
-
If the event is a site event, occurring at site
pi
-
Then HandleSiteEvent(pi)
-
Else HandleCircleEvent(pl),
where
pl is the lowest point of the circle causing the event.
-
Remove the event from Q.
-
The internal nodes still present in T correspond to the half-infinite edges
of the Voronoi diagram. Compute a bounding box that contains all vertices
of the Voronoi diagram in its interior, and attach the half-infinite edges
to the bounding box by updating the doubly connected edge list appropriately.
-
Traverse the half-edges of the doubly connected edge list to add the cell
records and the pointers to and from them.
The procedures to handle the events are defined as follows.
HandleSiteEvent(pI)
-
Search in T for the arc a vertically above pi,
and delete all circle events involving a from
Q.
-
Replace the leaf of T that represents a with
a subtree having three leaves. The middle leaf stores the new site pi
and the other two leaves store the site pj that was originally
stored with a. Store the tuple <pj,
pi> and <pi, pj> representing the new
breakpoints at the two new internal nodes. Perform re-balancing operations
on T if necessary.
-
Create new records in the Voronoi diagram structure for the two half-edges
separating V(pi) and V(pj), which will be traced
out by the two new breakpoints.
-
Check the triples of consecutive arcs involving one of the three new arcs.
Insert the corresponding circle event only if the circle intersects the
sweep line and the circle event is not present yet in Q.
HandleCircleEvent(pl)
-
Search in T for the arc a vertically above pl
that is about to disappear, and delete all circle events that involve a
from Q.
-
Delete the leaf that represents a from T. Update
the tuples representing the breakpoints at the internal nodes. Perform
re-balancing operations on T if necessary.
-
Add the center of the circle causing the event as a vertex record in the
Voronoi diagram structure and create two half-edge records corresponding
to the new breakpoint of the Voronoi diagram. Set the pointers between
them appropriately.
-
Check the new triples of consecutive arcs that arise because of the disappearance
of a. Insert the corresponding circle event
into Q only if the circle intersects the sweep line and the circle event
isnt present yet in Q.
Finally, lets see the complexity of Fortunes algorithm. In particular,
we have the following theorem.
THEOREM 3: The algorithm runs in O(n log n)
time and it uses O(n) storage.
Proof: The primitive operations on the tree T and the event queue
Q, such as inserting or deleting an element, take O(log n)
time each. The primitive operations on the data structure containing the
Voronoi
diagram, i.e., the doubly connected edge list, take constant time. To handle
an event we do a constant number of such primitive operations, so we spend
O(log n) time to process an event. Obviously, there are n
site events. As for the number of circle events, we observe that every
such event that is processed defines a vertex of Vor(P). Note that false
alarms (the circle events that do not define a vertex) are deleted before
they are processed. They are processed and deleted while processing another
real event and the time we spend on them is subsumed under the time we
spend to process this event. Hence, the number of circle events that we
process is at most 2n 5. The time and storage bounds follow.