This chapter covers results in the foundational paper Deep Inside Convolutional Networks: Visualizing Image Classification Models and Saliency Maps available at this Arxiv link.
The lecture slides are available here.
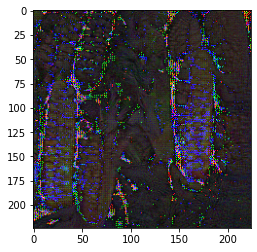
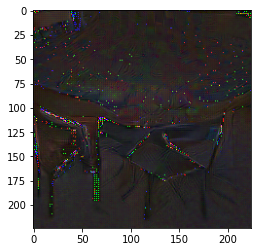
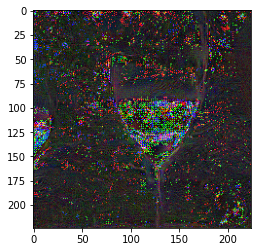
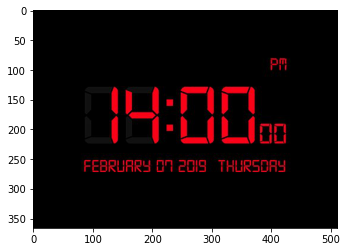
A minimal working example for visualizing an input given a class label is presented in the Colab document. Here are a few illustrations generated by this minimal example:
| Corn | Dining Table | Red Wine | Pineapple |
|---|---|---|---|
|
|
|
|
Using any input benchmark of your choice such as ImageNet and any model of your choice such as ResNet101, write a Jupyter notebook to visualize the input for a given class (60 points). Use an optimization different from the one presented in the minimal working example above.
What is the impact of the choice of the initial image on your results? The initial image could be all zeros, all ones, random, or other choices you deem fit. (10 points)
What is the impact of the choice of optimization parameters on your results? (10 points)
What is the impact of the number of steps on your results? (10 points)
Demonstrate your code on 10 examples of your choice. (10 points)
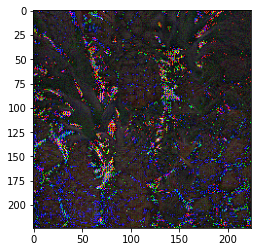
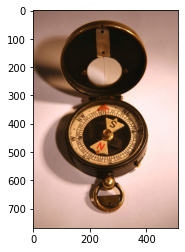
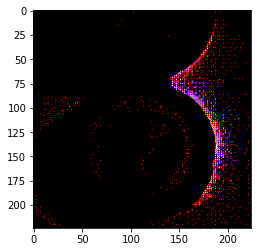
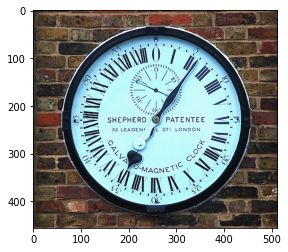
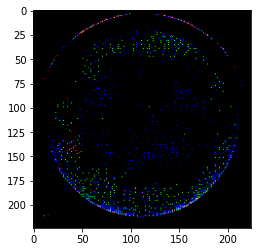
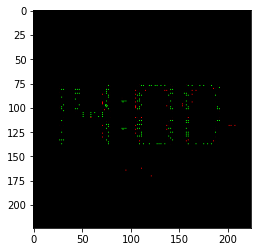
A minimal working example for creating an attribution similar to the saliency map of an input given a class label is presented in the Colab document. Here are a few illustrations generated by this minimal example:
| Image | Attribution |
|---|---|
 |
 |
 |
 |
 |
 |
Using any input benchmark of your choice such as ImageNet and any model of your choice such as ResNet101, write a Jupyter notebook to identify components of an input that cause it to be predicted as a given label (40 points). Do not copy code from the minimal working example above.
Use a trained model and an adversarially trained model (as in the minimal working example above), and comment on any differences you notice. (20 points)
The minimal working example multiplied the input by 0.05 before computing the saliency map. Vary this parameter between 0.01 and 1.0, and comment on any observations you make. (20 points)
Compute the saliency map for an input on its correct label and a few incorrect labels. Comment on any observations. (10 points)
Demonstrate your code on 10 examples of your choice. (10 points)
These assignments will be evaluated as graduate assignments, and there is no single correct answer that is expected. A variety of answers can equally satisfy the requirements in the above assignments.
Q1. I was wondering if you want the notebook to look like the example one, such as including load model, load input, transformation, and visualization?
A1. The code does not have to look like the example notebook. You can arrange the workflow in the code as you deemed fit.
Q2. If we do, for loading input do we load it from http://sumitkumarjha.com/ as well or pick a picture from imageNet? For transformation, can I do something like the example?
A2. You can use any inputs, such as pictures from the ImageNet, MNIST, CIFAR10, SVHN, or RESISC45 benchmark data set. You should make an attempt to use different transformations and different inputs, if possible. You can even use non-image inputs, if that makes things interesting such as use a Fast Fourier Transform on audio or EM signals from different benchmark data sets.
Q3. For benchmark, I didn’t see one being used in the example notebook, I was wondering if you can explain more about that?
A3. We would like the inputs to come from a publicly available benchmark data set such as ImageNet so that trained models may be easily available for your use.